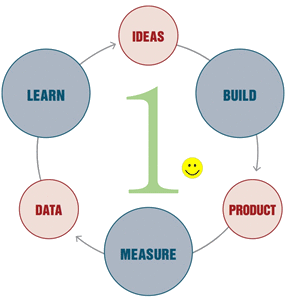
Let’s take a look at the classic Build-Measure-Learn cycle. How many people should be required in order to complete one iteration? Most successful developers I worked with were able to build a feature, collect telemetry data for it, analyze the data, tweak the feature accordingly and continue to the next iteration. People who can do this are unstoppable in building software that matters because they can iterate and learn very quickly.
In many cases, completing the Build-Measure-Learn cycle requires just a small set of skills in addition to coding. These skills can be learned in a matter of weeks and at the job. They do not require deep statistical background. Of course, there will be cases when data does not make sense or when complex data modeling is required. That’s the time to engage with a data scientist if your team is lucky to have one.
What does it take to enable every developer to complete the Build-Measure-Learn cycle? The “Build” part is given. Democratizing the “Measure” part requires a simple and robust data infrastructure. It should take one line of code to send an event when something interesting happened and one line of code to query the number of such events from a data store. If your team does not have a data infrastructure yet, it’s usually easier to leverage existing one instead of building your own. Shop around, there are a few good available. Some of them even hook into standard systems events like web requests so you do not need to write instrumentation code at all. And please do not build yet another dashboard just to show your telemetry data.
It’s traditional to think that the “Learn” part requires a trained data scientist or a market specialist. Sometimes this is true but in many cases it does not. Before starting on Bing performance I was a developer who spent most time writing code, debugging issues and analyzing error logs. In other words, dealing with one data point at a time. Back then I did not consider Excel or R as a part of my toolbox.
Developers are really good in dealing with one data point at a time. Here are specific things they can do to learn about their software from data. Spend a day or two to figure out how to connect Excel to telemetry data source and play with the data in a Pivot table. Start by plotting a daily trend of the number of users for your feature. Does it match expectations? Do weekends get higher or lower usage? Now take several weeks of data. Does the number of users trend up or down? If the overall usage is low, test all entry points for the feature and think how a list of entry points can be expanded.
Next, pick a metric that impacts user experience and you have direct control over. It may be a number of errors per user per day or 75th percentile of the application start time. Plot a daily trend. Does it match your expectations? Does it trend to the right direction? To improve the metric, think about a dimension that can impact the metric and “segment” by it. I wrote about funnels and segmentation in 3 Ingredients to Start Data-Driven Engineering Smooth and Easy. This will make the data actionable and allow you to change code and improve the metric.
Build-Measure-Learn cycle must be fast in order to stay competitive. I encourage software developers to complete it without external help as frequently as possible.