I care deeply that software engineers embrace data-driven culture, and here is why. What stops every developer from completing the build-measure-learn cycle? Why is it so hard and takes time to adjust? Because data-driven software engineering is different from classy design and coding. It is different from process we learn in college. Spending several days querying usage data and playing with it in Excel and R instead of coding – are you kidding me? This sounds like waste of time. Or isn’t it? Becoming data-driven is a big change, and change is hard.
The good news is that there is a formula to drive a change. It was invented in early 1960s and got better with time, like aged cheese and wine.
Dissatisfaction * Vision * First Steps > Resistance
Most changes require effort and face resistance. To overcome resistance, we must highlight dissatisfaction with how things are now, paint vision of what is possible, and define first concreate steps towards the vision. Don’t bother with detailed plans. Details make things boring and fuel resistance. Teams will figure out details when they support the change and start applying it.
Let’s go ahead and apply this formula to bring data-driven engineering to software developers.
Developers can resist becoming data-driven simply because they don’t know how powerful it is and how to do it. Management can be concerned with the cost. Deep in our souls, we may fear to fail with the new definition of success. Well, these are big challenges to overcome.
Dissatisfaction in the non-data-driven world comes from decision making. There are 3 popular ways to make decisions in software: intuition, usability studies, and data. Human’s intuition is awesome to brainstorm and innovate, but it is just terrible in deciding what features and designs should be implemented so they are used and loved by millions. We have different background and experience and can spend endless hours debating whos design is “better”.
To prove this, pick your favorite A/B experiment and ask a team to vote on its design. For example, Bing tweaked colors on the search results page and massively increased engagement and revenue. You can learn about this and other Bing’s experiments in Seven Rules of Thumb for Web Site Experimenters. I use this example a lot to test intuition. A half of the room usually gets it wrong. An intuition driven decision about these colors would be gabling on company’s money.
I think that usability studies are great. We should continue running them to learn what experiments to run next. However, these studies tend be biased because most companies cannot invite all their customers to a usability lab. These studies suffer from the measurement effect because people behave differently when they know that others are watching them. A few years ago, Bing experimented with a gray page background. Customers loved this new modern look at usability studies. However, user engagement and revenue dropped sharply in the A/B experiment that tried the gray background. It was shut down as a live site incident. Guess what, Bing’s background is still white.
It may feel awkward to bring up A/B experiments every time a non-data-driven decision is made. An alternative is to ask questions about feature usage, entry points, and success criteria when team’s priorities are discussed. Create a culture that empowers and encourages every team member to ask these questions.
Vision is the easiest part of the formula. I cannot imagine a self-respectful team that doesn’t want to justify its existence by measuring its business impact. A team that doesn’t want to invest precious time to improve most popular features and to fix most damaging bugs.
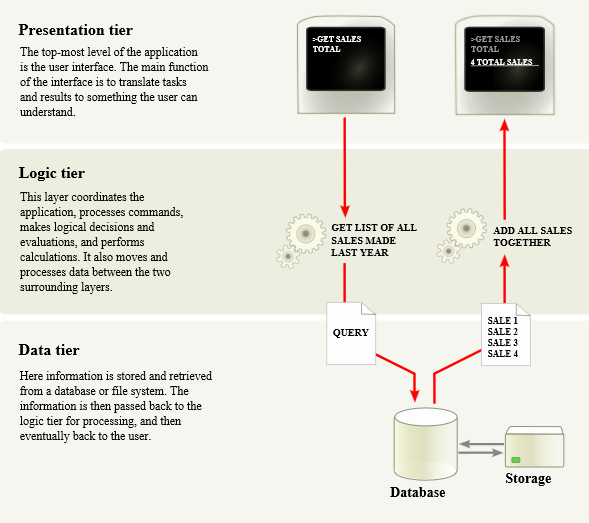
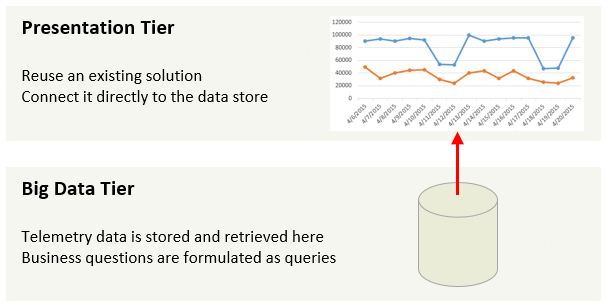
First steps tend to be a challenge. Many pieces have to come together before you can benefit from data-driven decisions. Start with infrastructure that enables easy instrumentation and data access. It can take months to build a data pipeline from the ground up. Don’t do this. Instead, shop around for a telemetry solution that works well for your platform. Telemetry data is boring. Insights are interesting and unique, but the data is just a set of events with properties such as a timestamp and a user ID. Borrow and reuse as much as possible. It should take hours, not months, to get the data flowing. Instrumentation and query are the only parts of the data pipeline that are unique to your application. This is the only code you should be required to write.
Next, you will need to define metrics to track and optimize. Start with counting users, clicks, and errors. Measure time to success and a success rate. Put these metrics on a dashboard and bring them up at standups and team meetings. The team will soon develop instincts when data looks normal and when it is time to investigate. Later, you can automate this process with alerts. Add properties specific to your domain to debug data with funnels and segments. Leverage data to justify building or cutting features, fixing usability issues, and optimizing reliability and performance.
I would love to hear your stories – what worked and what didn’t? Please share them in comments or send them to me, whatever works best for you.